What a data analyst resume must show
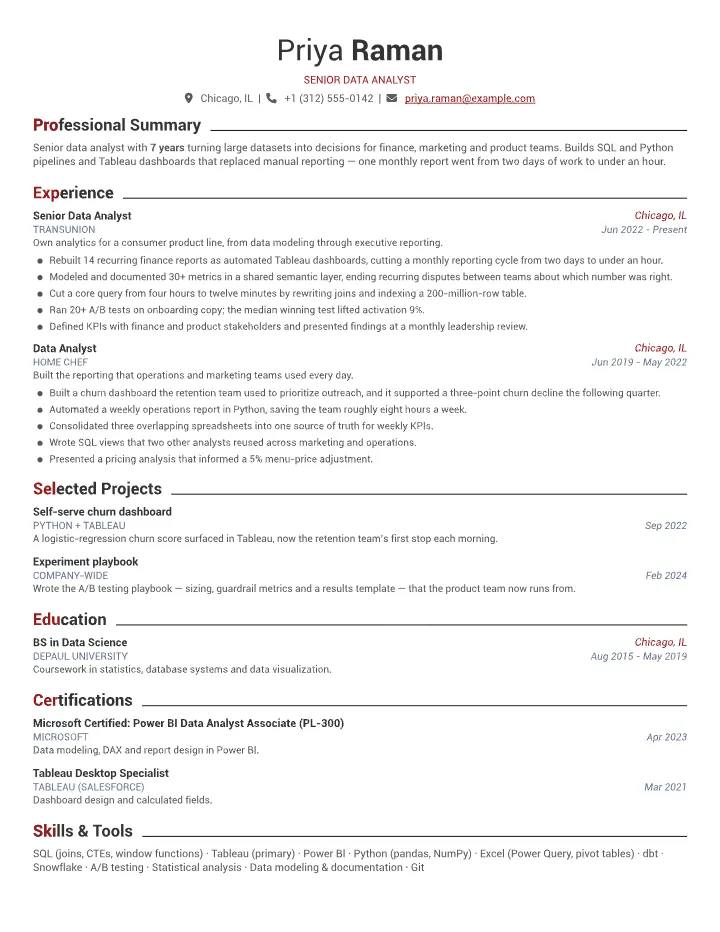
This is a complete, editable sample for a senior data analyst — seven years across consumer and credit data in Chicago, the tools named honestly, and outcomes stated in the numbers a hiring manager cares about. Open it, replace the details with yours, and export.
- The tools by name — SQL first
- SQL is required in most data analyst postings, followed by a BI tool (Tableau or Power BI) and Excel. Name each one you actually use at a professional level; a wall of generic "data" skills says nothing.
- Impact, quantified
- Reporting time saved, revenue or conversion moved, hours returned to a team. Analysts are hired to change a decision, so the resume should read as a list of outcomes rather than a list of queries written.
- The business domain you supported
- Finance, marketing, product, operations, risk. Two analysts with the same SQL depth fit very different teams, and naming the domain is how a hiring manager places you.
- The scale of data you have worked with
- Millions of rows, hundreds of gigabytes, dozens of tables. Scale signals seniority — a pipeline over 200M rows is a different job from a spreadsheet of a few thousand.
- How you made others self-sufficient
- Dashboards teams actually use, a documented metric layer, SQL views others reused. Enablement beats one-off pulls, and it is what separates a senior analyst from a report-taker.
- Statistical judgment, stated plainly
- A/B testing, hypothesis testing, regression. If you have run experiments, say what you measured and how large the effect was — with the honesty that most winning tests move a metric by single digits.
Data Analyst-specific resume tips
Not generic advice — the things that move a data analyst application forward.
SQL is the one skill to lead with
It is required in most data analyst postings, and it is what an interviewer will test first. Say the depth — joins, CTEs, window functions, query tuning — rather than a bare "SQL" or a vague "data skills".
Quantify with time and money, not tool lists
"Rebuilt 14 reports as Tableau dashboards, cutting a monthly cycle from two days to under an hour" tells a hiring manager more than naming every tool you have opened. Reporting-time reduction, revenue moved and hours returned are the outcomes this field is measured on.
Name your BI tool, because teams standardize on one
A shop running Power BI does not want to retrain a Tableau-only analyst, and vice versa. State the tool plainly, and if you know both, say which is your primary.
State the scale of the data
Rows, tables and gigabytes are how analysts size each other up. A query over a 200M-row table, or a warehouse of a few hundred GB, sets the level of the work more precisely than the job title does.
Say which business you supported
Marketing, finance, product, operations, risk — the domain shapes which metrics you know and which stakeholders you can speak to. Naming it is how you match a specific team rather than "data" in general.
Show enablement, not just analysis
A dashboard the sales team opens every morning, a metric layer other analysts build on, a documented table everyone shares. Work that makes other people self-sufficient is the strongest seniority signal on an analyst resume.
Report experiment results honestly
Most winning A/B tests move a metric by single digits; a median lift of 8–10% is a strong, credible result. A claimed 200% lift invites a hiring manager to disbelieve the rest of the resume.
One page, unless every line carries a result
One page is standard for a mid-to-senior analyst; use a second only if every line carries a query, a pipeline or a measured outcome. Length is not the problem; padding is.
What gets data analyst resumes rejected
Each of these reads as a red flag to the person doing the hiring.
A tool list with no outcomes
A skills block of SQL, Python, Tableau and Excel with nothing attached describes every applicant. Without at least one number per role, there is no reason to interview you over the next resume.
Writing "familiar with SQL"
Data work lives in SQL, and "familiar" reads as "I can write a basic SELECT". State the depth you actually work at — joins, CTEs, window functions, tuning — or leave it to the skills line.
No business context
A resume of techniques with no domain leaves a hiring manager unable to picture you on their team. Say which function you served and which decisions your analysis changed.
Dashboard counts you cannot show
"Built 100 dashboards" invites the obvious follow-up. A smaller, specific number you can walk through in an interview is far stronger than a big round one you cannot.
Certifications that do not match the stack
A certificate that does not match the stack the team runs is noise. List the credential that matches the team you are applying to, and only if it is real.
Metrics that collapse under one question
Any number on the resume is fair game in the interview. A lift or a saving you cannot explain how you measured does more damage than leaving it off.
Data Analyst resume FAQs
Do I need a degree or a license to be a data analyst?
There is no license for data analysis in the US. A bachelor’s in statistics, data science, mathematics or a related field is the common expectation, but the tools and a demonstrated project carry as much weight as the degree line.
Which tool should I lead with on a data analyst resume?
SQL, because it appears in the largest share of postings, then the BI tool the team runs (Tableau or Power BI), then Python. Name the depth you work at — joins, CTEs, window functions — rather than a bare "SQL".
Source: O*NET hot technologies
Which data analytics certifications are worth listing?
The Microsoft Power BI Data Analyst (PL-300) and the Tableau Desktop Specialist are the two that match a stack. List the one that fits the team you are applying to, and only if you actually hold it.
Source: Microsoft
Do I need a portfolio or a GitHub as a data analyst?
It is not required, but a project with a real dataset and a stated result — a dashboard, a pipeline, an analysis that changed a decision — is a strong differentiator, especially early in your career.
How do I show impact on a data analyst resume?
Attach a number to each result: reporting time saved, revenue or conversion moved, hours returned to a team. Analysts are hired to change a decision, so an outcome beats a list of queries written.
How long should a data analyst resume be?
One page is standard for a mid-to-senior analyst; use a second only if every line carries a query, a pipeline or a measured outcome. Length is not the problem; padding is.
Plain-text version
Prefer to start from text? Copy this sample and paste it into any editor.
Priya Raman
Senior Data Analyst
[email protected] | +1 (312) 555-0142 | Chicago, IL

PROFESSIONAL SUMMARY
Senior data analyst with 7 years turning large datasets into decisions for finance, marketing and product teams. Builds SQL and Python pipelines and Tableau dashboards that replaced manual reporting — one monthly report went from two days of work to under an hour.

EXPERIENCE
Senior Data Analyst — TransUnion
Jun 2022 – Present | Chicago, IL
Own analytics for a consumer product line, from data modeling through executive reporting.
• Rebuilt 14 recurring finance reports as automated Tableau dashboards, cutting a monthly reporting cycle from two days to under an hour.
• Modeled and documented 30+ metrics in a shared semantic layer, ending recurring disputes between teams about which number was right.
• Cut a core query from four hours to twelve minutes by rewriting joins and indexing a 200-million-row table.
• Ran 20+ A/B tests on onboarding copy; the median winning test lifted activation 9%.
• Defined KPIs with finance and product stakeholders and presented findings at a monthly leadership review.

Data Analyst — Home Chef
Jun 2019 – May 2022 | Chicago, IL
Built the reporting that operations and marketing teams used every day.
• Built a churn dashboard the retention team used to prioritize outreach, and it supported a three-point churn decline the following quarter.
• Automated a weekly operations report in Python, saving the team roughly eight hours a week.
• Consolidated three overlapping spreadsheets into one source of truth for weekly KPIs.
• Wrote SQL views that two other analysts reused across marketing and operations.
• Presented a pricing analysis that informed a 5% menu-price adjustment.

SELECTED PROJECTS
Self-serve churn dashboard — Python + Tableau
Sep 2022
A logistic-regression churn score surfaced in Tableau, now the retention team’s first stop each morning.

Experiment playbook — Company-wide
Feb 2024
Wrote the A/B testing playbook — sizing, guardrail metrics and a results template — that the product team now runs from.

EDUCATION
BS in Data Science — DePaul University
Aug 2015 – May 2019 | Chicago, IL
Coursework in statistics, database systems and data visualization.

CERTIFICATIONS
Microsoft Certified: Power BI Data Analyst Associate (PL-300) — Microsoft
Apr 2023
Data modeling, DAX and report design in Power BI.

Tableau Desktop Specialist — Tableau (Salesforce)
Mar 2021
Dashboard design and calculated fields.

SKILLS & TOOLS
SQL (joins, CTEs, window functions) · Tableau (primary) · Power BI · Python (pandas, NumPy) · Excel (Power Query, pivot tables) · dbt · Snowflake · A/B testing · Statistical analysis · Data modeling & documentation · Git